Early November 1 November
57°F
Typical afternoon high
41% historical wet-day frequency
Netherlands · City
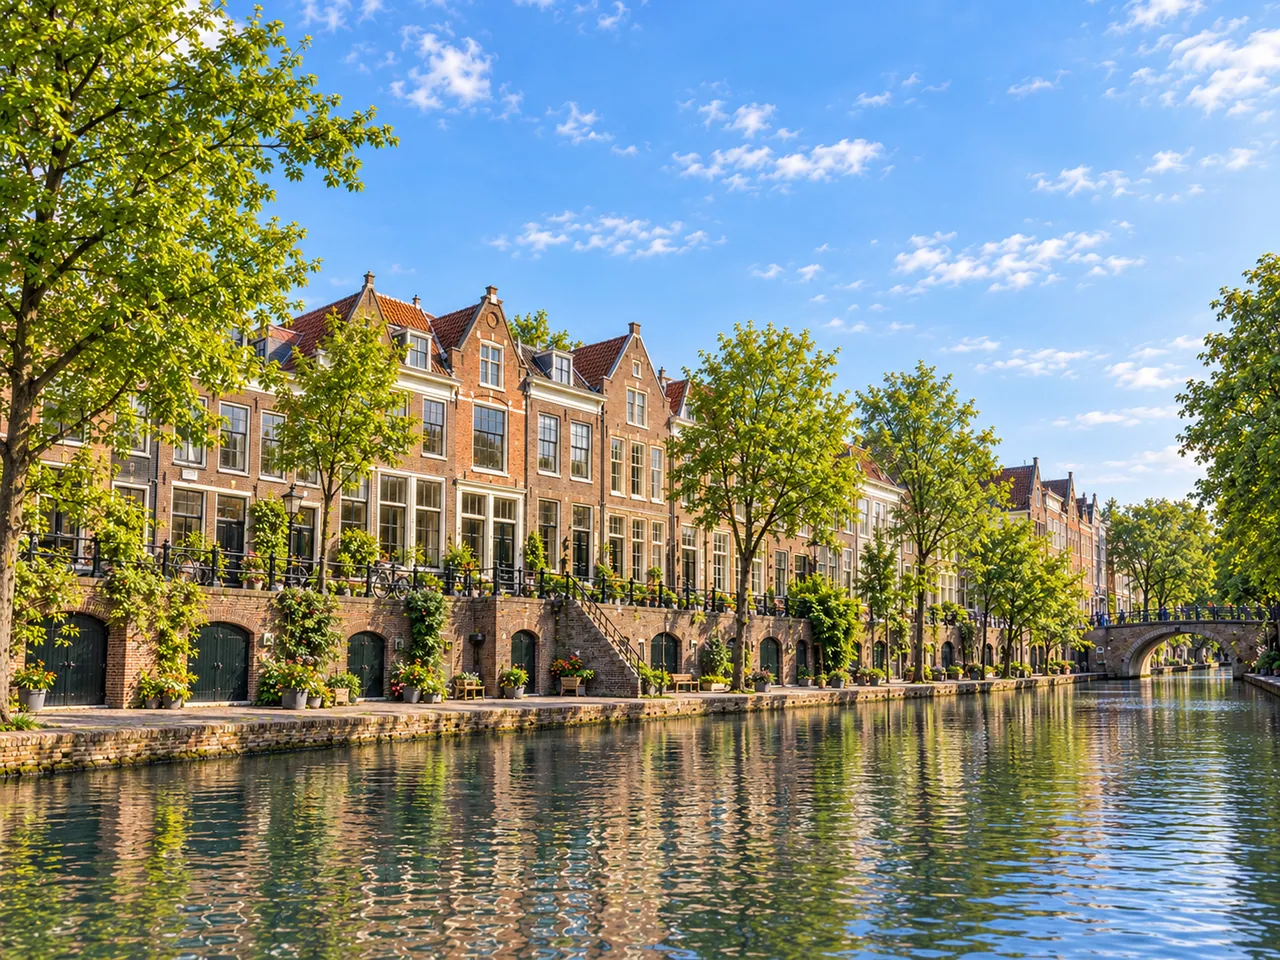
Is November a good time?
November averages 51°F afternoons, with about 12 rain days. Later November is typically cooler.
Historical Utrecht regional averages, not a forecast or a measure of queues. Overnight demand compares average stays per day.
What matters most?
Weather 50% · Crowds 30% · Cost 20%
#9 of 12 months here · Balanced mix
Overall combines weather, overnight demand and cost. It does not include sea temperature.
Plan your November
Afternoons around 51°F (11°C): a sweater and a light jacket; nights around 40°F (4°C): a warm coat. Bring rain gear: about 12 days with at least 1 mm of rain. About 9 hours of daylight.
The sun rises about 07:58 and sets about 16:50 (local time, mid-month). Mornings start around 40°F (4°C); afternoons reach about 51°F (11°C). Expect rain on about 12 days in a typical November.
Early, middle or late?
Early November is typically warmer. The afternoon high averages 57°F on the 1st, versus 47°F on the 30th.
57°F
Typical afternoon high
41% historical wet-day frequency
51°F
Typical afternoon high
37% historical wet-day frequency
47°F
Typical afternoon high
41% historical wet-day frequency
Historical daily averages from 2011–2025, smoothed over two weeks. A seasonal pattern, not a forecast. This does not establish which week has the lowest prices or fewest visitors.
Weather shows historical patterns, not a forecast. Holidays and events use the dates shown for 2026.
| Mon | Tue | Wed | Thu | Fri | Sat | Sun |
|---|---|---|---|---|---|---|
| 157° | ||||||
| 256° | 356° | 456° | 555° | 655° | 754° | 854° |
| 954° | 1053° | 1153° | 1252° | 1352° | 1451° | 1551° |
| 1651° | 1751° | 1850° | 1950° | 2050° | 2149° | 2249° |
| 2348° | 2448° | 2548° | 2647° | 2747° | 2847° | 2947° |
| 3047° |
Afternoon high rain likely (25%+) local school holidays public holiday event
Afternoons cool from about 56°F (13°C) in the first week to 47°F (8°C) in the last. The chance of a wet day runs 37–42%.
No school holidays here in November 2026. Elsewhere in November 2026, the share of people living where schools are out on a typical day: Belgium 16%, Lithuania 23%, Luxembourg 27%. (School holidays: OpenHolidays, ODbL.)
Visitor season
Moderate season. November averages 53% of August's overnight stays per day. Fewer overnight stays than October.
Overnight stays across Utrecht do not measure queues, day visitors or congestion at individual sights.
Hotel price season
Well below usual. Estimated from national hotel prices and local visitor demand; no measured regional room rate is available.
Fewer overnight stays do not automatically mean cheaper rooms. Check actual quotes for your trip.
Year-to-year variation
In the 15 years from 2011 to 2025, the month's afternoons averaged between 48°F (9°C) and 54°F (12°C); in 12 of them they were within 3°F (1.5°C) of the typical 51°F (11°C). Rain days ranged from 3 to 20; half the years had 10–15.
Rain days in each November
| Year | Afternoon high | Rain days |
|---|---|---|
| 2011 | 53°F | 3 |
| 2012 | 50°F | 11 |
| 2013 | 49°F | 15 |
| 2014 | 52°F | 12 |
| 2015 | 54°F | 17 |
| 2016 | 48°F | 13 |
| 2017 | 51°F | 14 |
| 2018 | 51°F | 7 |
| 2019 | 50°F | 12 |
| 2020 | 54°F | 10 |
| 2021 | 51°F | 10 |
| 2022 | 53°F | 17 |
| 2023 | 51°F | 20 |
| 2024 | 50°F | 11 |
| 2025 | 51°F | 11 |
Checked against 2 local weather stations. How we check
Compare dates
| Typical conditions | Oct | Nov | Dec |
|---|---|---|---|
| Afternoons | 61°F | 51°F | 47°F |
| Rain days | 12 | 12 | 15 |
| Overnight demand | 64% | 53% | 47% |
October: Warmer afternoons than November. More overnight demand. October guide →
December: Cooler afternoons and more rain days than November. Less overnight demand. December guide →
Overnight demand measures accommodation stays, not queues.
Yellow marks the top three months on the Balanced mix. November stays as your reference.
April to October have a Weather score at least 1.0 point higher than November, but more overnight stays.
Your comparison
Overnight stays are 64% of the busiest month.
National hotel prices and local visitor demand suggest about usual. No measured regional room rate is available.
Read the October guide →| Typical conditions | November | October |
|---|---|---|
| Afternoons | 51°F | 61°F |
| Nights | 40°F | 46°F |
| Rain days | 12 | 12 |
| Visitor season | Moderate season | Busy season |
| Overall / 10 | 6.2 | 6.4 |
| Month rank | #9 | #6 |
| Month | Overall | Rank | High | Low | Rain days | Weather | Visitor season |
|---|---|---|---|---|---|---|---|
| January | 5.2 | #12 | 45°F | 34°F | 16 | 4.2 | Moderate season |
| February | 5.8 | #10 | 47°F | 33°F | 9 | 4.8 | Moderate season |
| March | 6.7 | #3 | 53°F | 36°F | 11 | 5.9 | Moderate season |
| April | 6.2 | #8 | 59°F | 40°F | 7 | 7.0 | Busy season |
| May | 6.2 | #7 | 66°F | 47°F | 8 | 8.0 | Peak season |
| June | 6.5 | #5 | 72°F | 53°F | 9 | 8.7 | Peak season |
| July | 6.7 | #2 | 75°F | 55°F | 13 | 8.9 | Peak season |
| August | 6.5 | #4 | 75°F | 55°F | 11 | 9.0 | Peak season |
| September | 6.9 | #1 | 69°F | 51°F | 11 | 8.6 | Busy season |
| October | 6.4 | #6 | 61°F | 46°F | 12 | 6.7 | Busy season |
| November | 6.2 | #9 | 51°F | 40°F | 12 | 5.2 | Moderate season |
| December | 5.4 | #11 | 47°F | 37°F | 15 | 4.4 | Moderate season |
Near here
Nearby regions, nearest first. Distances are centre to centre, as the crow flies; they are not road distances or journey times.
 Rotterdam, The Hague & South HollandNetherlands · about 30 miles
Balanced Overall 6.1 · Good weather, 52°F (11°C) · Moderate season · Cost pricey
 GelderlandNetherlands · about 30 miles
Balanced Overall 6.7 · Good weather, 51°F (10°C) · Low season · Cost pricey
 Amsterdam & North HollandNetherlands · about 40 miles
Balanced Overall 6.0 · Good weather, 52°F (11°C) · Moderate season · Cost pricey
 Cologne & BonnGermany · about 110 miles
Balanced Overall 5.7 · Good weather, 51°F (10°C) · Steady all year · Cost pricey
 Weser-Ems & the North Sea coastLower Saxony · Germany · about 120 miles
Balanced Overall 6.5 · Good weather, 49°F (10°C) · Low season · Cost pricey
Elsewhere in Europe
Utrecht's weather ranks 23 of 41 city regions this month. These city regions outside Netherlands have clearly better weather on your dates, nearest first, each compared with Utrecht.
 Bologna & Emilia-RomagnaItaly · about 590 miles
Good weather (6.6): 7°F warmer afternoons, quieter for its season (low season)
 Barcelona & CataloniaSpain · about 730 miles
Very good weather (8.2): 12°F warmer afternoons, 6 fewer rain days, quieter for its season (low season)
 AragonSpain · about 780 miles
Very good weather (7.5): 9°F warmer afternoons, 6 fewer rain days, quieter for its season (low season), cheaper
 Rome & LazioItaly · about 780 miles
Very good weather (7.4): 12°F warmer afternoons, cheaper
 BelgradeSerbia · about 870 miles
Good weather (6.4): 4°F warmer afternoons, 4 fewer rain days, cheaper
It's moderate season, 53% of the busiest month and 22% below its average month.The figures cover the whole Utrecht region, suburbs included. That means about 9,900 overnight visitors on a typical November night across the region, 71% of them from Netherlands itself. Rentals booked through Airbnb, Booking, Expedia and Tripadvisor add up to 860 more: 9 for every 100 counted above. Some are the same properties counted twice.
| Climate suitability (HCI:Urban, 0–100) | 61 |
| How our weather was checked | 2 open weather stations in this region, January and July: afternoon highs typically within 1°F (0.6°C), night lows within 1°F (0.2°C). |
| Tourist nights per 1,000 residents per day | 7 |
| Busiest month here | August · 13 |
| Visitors as share of people present | 0.7% |
| Rank among Europe's regions this month | 39th percentile |
| Domestic share of nights | 71% |
| Platform rental nights per 100 counted nights | 9 |
| Visitor share if every platform night were extra | 0.8% |
| National hotel-price season | Netherlands historical 2024–2025 index: Well below usual (−12% vs its average month). Not a local room quote. |
| Population used | 1.4 million |
| Statistical region | NL35 · Utrecht |
Crowds: Eurostat nights spent at tourist accommodation, by month and NUTS 2 region, 2024–2025 average. Overnight visitors per night is the month's nights divided by its days; the per-1,000 figure is Eurostat's, against each year's population. Platform rentals: Eurostat nights booked via Airbnb, Booking, Expedia and Tripadvisor, 2024–2025 average, shown separately because some properties are in both counts. Weather: Holiday Climate Index computed from ERA5 reanalysis with daily highs, night lows and rain days corrected from open national weather-service station records, 2011–2025, population-weighted to the region; day-by-day figures are the same data averaged by date. Heat and rain odds are counted across those years. Sunrise and sunset: NOAA solar equations, local time. Prices: Eurostat price level index and HICP, national. Full method · this region's data.