Fewer crowds
January is quietest.
January, at 48% of the busiest month (July).
A good place. At the right time.
Plan your visit
What matters most?
Weather 50% · Crowds 30% · Cost 20%
#1 of 12 · Balanced · 6.6/10
Overnight stays are 84% of the busiest month.
Based on Stockholm regional averages.
The sea averages 54°F (12°C). Very cold: wetsuit weather. Warm air does not always mean warm water.
Check what is open. The off-season flag comes from visitor patterns. Confirm accommodation, services and transport for your dates.
Price context. Historical regional hotel revenue (2025 annual level, adjusted by the 2024–2025 national hotel index): €78 per guest-night. A seasonal estimate, not a booking quote.
Historical averages, not forecasts or live prices.
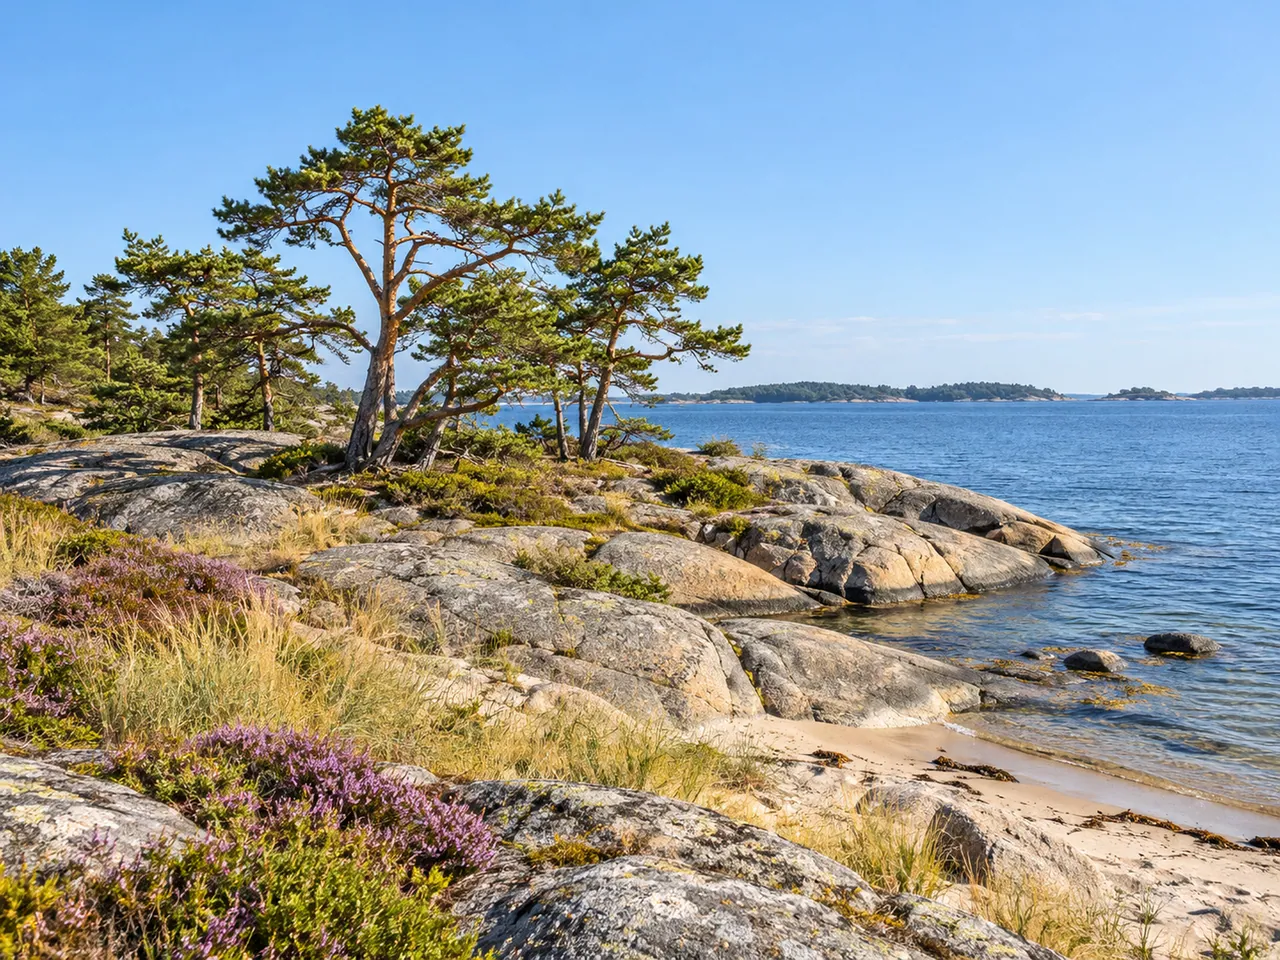
A regional guide. Figures cover Stockholm, including Stockholm archipelago. Conditions vary within the region.
The whole calendar
Explore your month, then weigh up the trade-offs.
Balanced match #1 · 6.6/10
Overnight stays are 84% of the busiest month.
The sea averages 54°F (12°C). Very cold: wetsuit weather. Warm air does not always mean warm water.
Check what is open. The off-season flag comes from visitor patterns. Confirm accommodation, services and transport for your dates.
Read the June guideAll 12 months, on the same measures. Tap a heading to sort or a month to open its guide.Select a month to open its guide. Scroll the table for more detail.
| Rank | Month | Overall | Weather | Crowds | Cost | High | Low | Sea | Rain days | Daylight |
|---|---|---|---|---|---|---|---|---|---|---|
| #1 | June | 6.6 | 8.9/10 Very good | Busy | Expensive | 69°F | 51°F | 54°F | 9 | 18h 36m |
| #2 | July | 6.3 | 9.5/10 Excellent | Peak | Expensive | 73°F | 55°F | 61°F | 10 | 17h 58m |
| #3 | August | 6.2 | 9.2/10 Excellent | Peak | Expensive | 71°F | 54°F | 63°F | 10 | 15h 40m |
| #4 | September | 6.2 | 7.8/10 Very good | Busy | Expensive | 63°F | 48°F | 58°F | 7 | 12h 59m |
| #5 | May | 5.9 | 7.5/10 Very good | Busy | Expensive | 61°F | 42°F | 45°F | 9 | 16h 57m |
| #6 | April | 5.9 | 6.0/10 Good | Busy | Expensive | 51°F | 33°F | 38°F | 5 | 14h 26m |
| #7 | March | 5.6 | 5.1/10 Good | Busy | Expensive | 42°F | 27°F | 36°F | 6 | 11h 40m |
| #8 | October | 5.2 | 5.5/10 Good | Busy | Expensive | 52°F | 40°F | 51°F | 10 | 10h 20m |
| #9 | February | 5.2 | 4.2/10 Fair | Moderate | Expensive | 36°F | 24°F | 36°F | 9 | 9h 11m |
| #10 | November | 5.0 | 4.5/10 Fair | Busy | Expensive | 43°F | 34°F | 46°F | 9 | 7h 44m |
| #11 | December | 5.0 | 4.0/10 Fair | Moderate | Expensive | 37°F | 29°F | 41°F | 12 | 6h 07m |
| #12 | January | 4.7 | 3.7/10 Fair | Moderate | Expensive | 34°F | 24°F | 38°F | 9 | 6h 48m |
Overall follows your priorities. Crowds compare each month with this place's own year. Highs, lows and rain days are historical averages for 2011–2025.
A little perspective
Top balanced match · June
Some weather measures are unavailable. Gaps in the chart mean no data.
Off season can mean fewer services. Confirm what is open for your dates.
Stockholm regional averages · Historical patterns, not a forecast. Gaps mean no data. Crowds compare months within this region.
The busiest month records 2.1 times the overnight stays of the quietest.
Very-good-or-better weather scores: May to September. No month has a poor weather score.
Peak-season months: July to August. No month falls in low season.
The two busiest months account for 23% of annual overnight stays.
Nonstop flights from the US (2024): all year, from Newark.
Events that move crowds and prices Midsummer, 25–27 June 2027: Swedes head to the countryside; cities empty and many businesses close. Official site.
Figures cover the whole Stockholm region, suburbs included. Historical hotel revenue here is estimated at €79 per guest-night in July and €67 in January.
Euro figures use the 2025 annual level, adjusted by the 2024–2025 national hotel index.
Before you go
January is quietest.
January, at 48% of the busiest month (July).
February, outside the busy season.
Very good or better May to September. July has the highest displayed weather score (9.5/10). Highest weather score outside the busy season: February.
December to February.
These are three lower-price months on the historical regional hotel series. The lowest monthly estimate is €67 in hotel revenue per guest-night in January. It uses the 2025 annual level, adjusted by the 2024–2025 national hotel index. These are seasonal estimates, not current booking quotes.
Summer break meets the busy season.
If your dates follow US school breaks: June falls in busy season; July and August fall in peak season. Spring break (March–April) falls in busy season.
Local school holiday dates are unavailable in our calendar; this does not mean schools are open.
These are historical seasonal patterns. Crowds compare a month with this place's own busiest month; they do not measure queues at individual sights. Weather answers use the displayed weather scores. These seasonal facts stay the same when you change your priorities; your Overall recommendation updates above. Prices retain the scope stated beside them. Full methodology.
Choose your season
Dec–Feb
Moderate visitor levels throughout.
34–37°FAfternoon highs
Mar–May
Busy throughout.
42–61°FAfternoon highs
Jun–Aug
A busy season for visitors.
June falls in busy season; July and August fall in peak season.
69–73°FAfternoon highs
Sep–Nov
Busy throughout.
43–63°FAfternoon highs
Ranges span monthly average afternoon highs, not daily extremes. Conditions and seasonal openings vary within Stockholm.
The default Balanced Overall weighs weather 50%, crowds 30% and cost 20%. Your priority choice updates the Overall, month ranks and recommendation. While your weather weight is at least 40%, Overall cannot exceed weather by more than 1. Close scores can describe different trip experiences. How the scores work.
| Statistical region | SE11 · Stockholm |
| Region type | City (Eurostat NUTS3 typologies weighted by population: urban 100%, coastal 100%, mountain 0%; median ground height 23 m; set by editorial override) |
| Population used | 2.5 million (1 January 2025) |
| Crowd reference years | 2024–2025 average |
| How our weather was checked | 9 open weather stations in this region, January and July: afternoon highs typically within 1°F (0.5°C), night lows within 1°F (0.6°C). |
| Climate index | HCI:Urban, observed climatology over 15 years (2011–2025) |
| Hotel occupancy (annual) | 63% |
| Accommodation mix | 91% hotels, 4% camping |
| Hotel rates | Tillväxtverket, Inkvarteringsstatistik 2025, table 1.1: accommodation revenue per guest-night (yearly, moved by the national hotel price swing) |
| Country price level (restaurants & hotels, EU27 = 100) | 117 |
| Daylight latitude | 59.47° N |
Crowds: Eurostat nights spent at tourist accommodation establishments by month and NUTS 2 region, per 1,000 inhabitants, divided by days in the month. "Season here" is the month's figure as a share of this region's busiest month. "Visitors" ranks overnight visitors per resident against all Europe's regions that month. Weather: Holiday Climate Index (Scott et al. 2016; Rutty et al. 2020) computed from ERA5 reanalysis with daily highs, night lows and rain days corrected from open national weather-service station records and population-weighted to the region. Prices are regional where the page says so (Tillväxtverket, Inkvarteringsstatistik 2025, table 1.1: accommodation revenue per guest-night (yearly, moved by the national hotel price swing)), otherwise national. Hand-written notes are marked and nothing depends on them. Full method · this region's data.